Seit der Version 7.2 ist der RapidMiner Server in einer eingeschränkten Version frei erhältlich, und es lassen sich sehr nützliche Dinge damit machen.
Eine Kernfunktion ist das geplante Ausführen von Prozessen. Das passiert mit Hilfe von Cron-Ausdrücken, wobei die Implementierung in RM Server die Cron-Syntax vorne um ein Sekunden-Feld erweitert. Das erhöht natürlich die Flexibilität, aber birgt eine Gefahr in sich: wenn man nicht aufpaßt, legt man ganz schnell einen Cron-Job an, der jede Sekunde einen Prozess startet. Das kann auch den besten Server schnell in die Knie zwingen.
Leider ist die Benutzeroberfläche so gestaltet, daß die Standardeinstellungen genau dieses Problem verursachen:
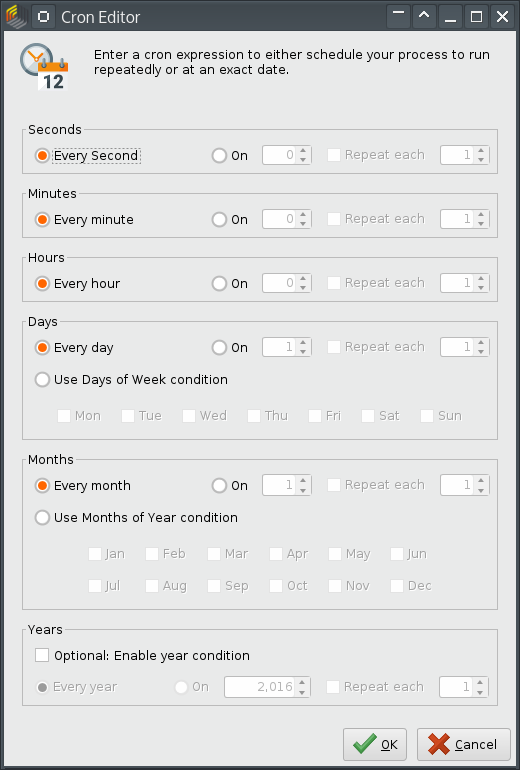
Wer intensiv an einem Server arbeitet, wird vielleicht früher oder später die Standardeinstellungen übernehmen. Oder es passiert jemandem in einem Training dieser Fehler. Glücklicherweise gibt es einen Weg, die Datenbank gegen diese Cron-Jobs abzusichern.
Mein RapidMiner Server verwendet eine PostgreSQL-Datenbank im Hintergrund. Die Tabelle qrtz_cron_triggers enthält die definierten Cron-Jobs. Es ist möglich, einen Trigger auf diese Tabelle zu legen, der unerwünschte Eingaben ablehnt oder, noch eleganter, korrigiert.
In PostgreSQL bestehen Trigger aus zwei Teilen: einer Triggerfunktion und dem eigentlichen Trigger. (Dadurch läßt sich eine Funktion für mehrere ähnliche Trigger verwenden, man muß sie nicht jedes Mal neu schreiben.)
Meine Triggerfunktion schaut so aus:
create or replace function check_second_cron() returns trigger
as $func$
begin
new.cron_expression = regexp_replace(new.cron_expression,
'^\s*(\*|\d+/\d)\s',
'0 ');
return new;
end;
$func$
language plpgsql;
Die Funktion ersetzt im hereinkommenden Cron-Ausdruck unerwünschte Sekundenangaben gegen 0. Eine unerwünschte Angabe ist * (jede Sekunde), die andere hat die Form X/Y (beginnend bei der Sekunde X, alle Y Sekunden). Hier vermeiden wir einstellige Sekundenangaben. Damit kann man einen Prozess alle 10 Sekunden oder seltener laufen lassen, aber nicht häufiger; das reduziert die Gefahr schon wesentlich.
Der reguläre Ausdruck schaut komplex aus, ist aber nicht so schlimm:
^\s* – Am Anfang darf Whitespace (Space oder Tabulator) vorkommen
(\*|\d+/\d) – Entweder ein Stern ODER Ziffer(n) gefolgt von einer Ziffer
\s – Wieder Whitespace
Der Trigger wird dann auf die Tabelle angewendet, und zwar sowohl bei Insert als auch bei Update, und auch nur, wenn der Cron-Ausdruck den unerwünschten Inhalt hat:
drop trigger if exists prevent_second_cron on qrtz_cron_triggers;
create trigger prevent_second_cron
before insert or update
on qrtz_cron_triggers
for each row
when (new.cron_expression ~ '^\s*(\*|\d+/\d)\s')
execute procedure check_second_cron();
Damit wurde der Server gegen die unabsichtliche oder bösartige Eingabe von zu häufig ausgeführten Cron-Prozessen abgesichert. (Natürlich könnte ein Angreifer auch anders viele Prozesse gleichzeitig starten; dagegen helfen nur Queues.)
Securing Cron in RapidMiner Server
A slightly limited version of RapidMiner Server is freely available since release 7.2. It is a very useful piece of software.
Scheduled process execution is a core functionality. The execution time and frequency are specified using Cron expressions; however, the implementation in RM Server extends the usual Cron syntax by a leading Seconds field. This gives us more flexibility but is also dangerous: If we aren’t careful, we can easily schedule a process to run every second. This can cause a huge usage even on the fastest server.
Unfortunately, the default settings in the user interface expose exactly this problem:
People working a lot on a server will probably accept the default values, or someone in a training makes a mistake. Fortunately, there’s a way to secure the database against this kind of Cron schedule.
My RapidMiner Server uses a PostgreSQL backend database. The table qrtz_cron_triggers contains the defined Cron jobs. It is easy to create a trigger on this table that rejects undesired input, or fixes it, which I consider more elegant.
Triggers consist of two parts in PostgreSQL: a trigger function and the actual trigger. (This allows us to use the same function in many triggers instead of writing it many times.)
This is my trigger function:
create or replace function check_second_cron() returns trigger
as $func$
begin
new.cron_expression = regexp_replace(new.cron_expression,
'^\s*(\*|\d+/\d)\s',
'0 ');
return new;
end;
$func$
language plpgsql;
The function replaces unwanted specification of seconds by zero. One kind of unwanted entry is * (every second), the other variant has the form X/Y (start at X seconds, repeat every Y seconds). Here we deny one-digit second entries. This allows us to schedule a process every 10 or more seconds, but not more frequently. This reduces the problem by a large margin.
The regular expression seems complex but it’s not too bad:
^\s* – The beginning of the expression can contain whitespace
(\*|\d+/\d) – A star OR digit(s) followed by / and one digit
\s – Whitespace again
The trigger is placed on the table both for Insert and Update and is executed when the expression has unwanted contents:
drop trigger if exists prevent_second_cron on qrtz_cron_triggers;
create trigger prevent_second_cron
before insert or update
on qrtz_cron_triggers
for each row
when (new.cron_expression ~ '^\s*(\*|\d+/\d)\s')
execute procedure check_second_cron();
Thus the server was secured against unintentional or malicious creation of Cron processes that run too often. (An attacker could start many processes at a time with other means, of course. This can be avoided with Queues.)
Der letzte Beitrag hat sich mit der Verbesserung von geographischen Joins in RapidMiner beschäftigt. Tatsächlich kann die beschriebene Methode aber auf alle Arten von Joins angewendet werden, die nicht nur für einen kleinen Nutzerkreis interessant sind.
Der eingebaute Join-Operator in RapidMiner erlaubt nur „ist gleich“-Vergleiche. In der Praxis sind aber auch andere Operationen nützlich: z. B. reguläre Ausdrücke, oder „kleiner gleich“.
Der Beispielprozess nutzt generierte Testdaten und wendet eine Liste von regulären Ausdrücken auf sie an. Wie schon bei den geographischen Joins wird dafür ein Scripting-Operator mit einem Groovy-Skript verwendet.
Das Skript muß wie gehabt ziemlich viel Datenverwaltung betreiben, um die resultierende Tabelle aus den beiden Eingangs-Tabelle zu bauen. Bei der Erstellung des Skripts war wichtig, daß es möglichst allgemein verwendbar ist. Das ist in Groovy mit Hilfe der Closure-Syntax möglich: die Join-Funktion wird am Anfang des Skripts als eine Art Konfigurationsvariable festgelegt. Somit sind im Skript nur drei Dinge festzulegen: die beiden Join-Attribute und der Ausdruck, der auf sie anzuwenden ist.
Die beiden Attributsvariablen aus Example Set 1 und 2 werden am Anfang angegeben. Hier müssen die Attributnamen exakt (inkl. Groß- und Kleinschreibung) angegeben werden.
Die Closure joinFunc nimmt zwei Parameter (e1 und e2) entgegen, das sind die Werte aus den genannten Attributen. Die Funktion prüft in diesem Fall, ob das Person-Attribut dem regulären Ausdruck aus dem zweiten Datensatz entspricht.
Für den Vergleich mehrerer Variablen muß das Skript dann doch angepaßt werden.
Das Skript verzichtet aus Performance-Gründen auf eine Prüfung, ob gleichnamige Attribute in beiden Datensätzen existieren. Im Zweifelsfall kann die Eindeutigkeit der Namen mit einem Rename by Replacing vor dem Join-Operator sichergestellt werden.
In SQL verwende ich immer wieder komplexe Joins – jetzt wird Ähnliches auch in RapidMiner möglich sein.
Generic Joins in RapidMiner
The last blog entry presented an improvement of geographic joins in RapidMiner. However, the described method can be applied to all kinds of joins, including those usable for a much larger group of analysts.
The Join operator in RapidMiner supports only the „is equal“ comparison. In reality, other operations like regular expression matching or „less or equal“ can be useful.
The example process uses generated data and joins a list of regular expressions with them. A Groovy script in an Execute Script operator is used, just like in the geographic joins.
Much data wrangling is done in the script as usual to build the resulting table from the incoming example sets. I developed the script with the goal of reusability. The closure syntax in Groovy makes this possible: the join function is specified in a kind of configuration variable at the top of the script. So to reuse the script you just need to set three variables: both join attributes and the expression to apply on them.
This is the configuration part in the example script:
The attribute variables from ExampleSet 1 and 2 are given in the first two rows. It is important to specify them exactly (including capitalization).
The closure called joinFunc takes two parameters (e1 and e2), the values of the selected attributes. In this case the function executes a regular expression match on them.
Other possible join criteria:
e1 <= e2 // less-or-equal comparison
e1 == e2 || e2 == null // comparison that allows missing data
and so on.
The script needs to be changed for joins on multiple variables.
For performance reasons the script doesn‘t check for duplicate attribute names in the incoming data sets. If unsure, just use a Rename by Replace operator before the join to make sure the names are unique.
I‘m using complex joins in SQL all the time – it‘s time to make similar things possible in RapidMiner!
Ich habe früher beschrieben, wie geographische Joins und Filter in RapidMiner mit Hilfe des Cartesian-Product-Operators umgesetzt werden. Dieser Ansatz ist relativ einfach nachvollziehbar und funktioniert mit kleinen Datenmengen ganz gut.
Leider wird bei einem Cartesian Join jede Zeile der beiden hineingehenden Datensätze miteinander kombiniert. Das Ergebnis des kartesischen Produkts hat dann so viele Zeilen wie das Produkt der beiden Datensatzlängen. Natürlich wird da viel Speicher verwendet, und die Schleife mit den gewünschten Berechnungen läuft länger.
Für größere Datenmengen mit jeweils Hunderten oder Tausenden von Zeilen gibt es einen besseren Ansatz. Der Script-Operator kann auch zwei ExampleSets verarbeiten. Mit einem etwas komplexeren Skript kann der Prozess in einer verschachtelten Schleife beliebige Join-Kriterien anwenden, ohne den Speicher mit einem temporären kartesischen Produkt zu belasten.
In diesem Beispielprozess hole ich von Open Data Wien eine Liste von über 28.000 Straßenabschnitten in Wien (als Linien) sowie die 23 Wiener Bezirke (als Flächen). Die Aufgabe ist, für jeden Bezirk die Straßen zu bestimmen, die in ihm liegen. Dafür wird die GeoScript-Funktion contains() verwendet.
Bei der Cartesian-Join-Methode werden für jede Zeile zwei als String gespeicherte Geo-Objekte konvertiert. Dies ist aufwändig, aber kaum zu vermeiden. Mit der verbesserten Methode ist es einfach, ein Array von konvertierten Geo-Objekten zu erstellen und indexbasiert abzufragen.
Das Ergebnis ist ein Prozess, der mit relativ geringen Speicher-Anforderungen und einer akzeptablen Geschwindigkeit auch größere Datenmengen verknüpfen kann.
Der Nachteil ist ein etwas komplexeres Skript, das jedoch nach der ersten Entwicklung leicht an neue Anforderungen angepaßt werden kann.
Der größere Aufwand lohnt sich aber auf jeden Fall. Der Beispielprozess ordnet auf meinem Rechner die 28.309 Straßen den 23 Bezirken in ca. 14 Sekunden zu. Ein versuchsweise erstellter alternativer Prozess, der mit Cartesian Join arbeitet, läuft über 20 Minuten, also fast 90 mal langsamer, und braucht dabei natürlich deutlich mehr Speicher.
Das Skript erstellt ein komplett neues ExampleSet, das alle Attribute aus den beiden hereinkommenden ExampleSets übernimmt (doppelte Attributnamen sollten vorher korrigiert werden). Das Ergebnis enthält nur die Datensätze, auf die die Bedingung zutrifft, es ist kein nachgeschalteter Filter notwendig.
Um das Skript möglichst wiederverwendbar/flexibel zu machen, werden alle prozess-spezifischen Teile am Anfang als Variablen konfiguriert. Das sind einerseits die Namen der beteiligten Attribute, andererseits aber auch die Join-Funktion. Da Groovy sogenannte Closures (Funktionsvariablen) anbietet, können wir am Anfang des Skripts die verwendete Funktion eingeben – die hier konfigurierte Funktion wird später im Join verwendet.
Konkret sieht die Definition so aus:
def joinFunc = { a1, a2 -> a1.contains(a2) }
Das bedeutet: eine Funktionsvariable namens joinFunc mit den Parametern a1 und a2 erstellen. Hinter dem -> erscheint der Inhalt der Funktion, in diesem Fall der Aufruf a1.contains(a2). Der Rückgabewert sollte ein Boolean sein; beim Rückgabewert True werden die beteiligten Zeilen ins Ergebnis ausgegeben. Der fixe Teil des Skripts ruft dann irgendwo in der Schleife die Funktion mit joinFunc(a1, a2) auf.
Diese Konstruktion hilft uns, das Skript einfacher wiederzuverwenden: Sollten wir einmal statt contains() etwa intersects() benötigen, braucht nur der Konfigurationsblock geändert zu werden. Wir müssen nicht mehr nach dem Funktionsaufruf irgendwo in den Tiefen des Skripts zu suchen.
Earlier I described geographic joins and filters in RapidMiner. The processes used the Cartesian Product operator. This approach is quite simple and easy to understand, and it works well with smaller data sets.
Cartesian Join combines each row of the incoming tables. The result has as many rows as the number of rows of both data sets multiplied together. This uses a lot of memory and the loop that calculates the results takes longer.
There‘s a better approach for larger data sets with hundreds or thousands of rows. The Execute Script operator can work with two incoming ExampleSets. A slightly more complex script can use nested loops to apply almost arbitrary join criteria on the data, without filling the memory with the cartesian product.
This example process fetches over 28,000 street segments as lines and 23 districts of Vienna as polygons from the Vienna Open Data server. The task is finding the streets inside each district. So this is a join based on the GeoScript function contains().
The Cartesian Join needs to convert two strings to Geometry objects in each line of the combined data set. This is slow and hard to avoid. The improved method makes it easy to create an array of converted Geometry objects and use them for further lookups.
The resulting process uses less memory and has an acceptable runtime even with large inputs. This comes at the cost of a more complex script; however, it should be easy to change the script for future requirements.
The effort is really worth it. On my computer the example process joins 28,309 streets with 23 districts in about 14 seconds. A variant of the process that uses Cartesian Join runs for over 20 minutes (about 90 times slower) and uses a lot more memory.
The script creates a new ExampleSet that combines all attributes of both incoming ExampleSets. (If you have duplicate attribute names, rename them before sending the data to the script.) The result contains only records that match the condition, no additional filtering is necessary.
In order to make the script as reusable as possible, all process specific parts are configured at the top in variables. There are variables for the join attributes‘ names and also for the join function. Groovy offers so-called Closures (function variables), so we can specify the function to use in the configuration block. The configured function will be used for joining later in the loop.
This is how the definition looks like:
def joinFunc = { a1, a2 -> a1.contains(a2) }
Translated: create a function variable called joinFunc created with parameters a1 and a2. The body of the function is specified after ->, in this case a1.contains(a2). The return value of the function should be a Boolean – if the value is True, the current rows will be put into the result example set.
The fixed part of the script calls this function using joinFunc(a1, a2) later in the loop.
With this construction we can reuse the script easily: If we need intersects() instead of contains() at some point in the future, we just change it in the script configuration, without having to analyze and change the code below.
Wie schon einige Male halte ich wieder einen Vortrag bei den Linuxwochen Wien. Dieses Jahr heißt mein Thema „Citizen Data Science“.
Der Begriff „Citizen Data Scientist“ wurde von großen Beratungsfirmen geprägt. Sie verstehen darunter Mitarbeiter in Unternehmen, die keine Data-Scientist-Ausbildung haben, aber trotzdem analytisch arbeiten.
Ich möchte mich allerdings auf mein Verständnis von „Citizen“– wir alle, nicht unbedingt in einem Unternehmenskontext – konzentrieren.
Im Vortrag geht es darum, was man sich unter Data Science vorstellen kann, welche Werkzeuge und Methoden es gibt, und wie man mit frei verfügbarer Software Daten holen, zusammenführen, verarbeiten und analysieren kann.
Einige Themen: Open Data und Web-APIs; Datenbanken; Software für Analytik.
Die nächsten RapidMiner-Trainings in Wien (Basics 1 + 2: Einführung in Datenvorverarbeitung und Predictive Analytics/Data Mining mit RapidMiner) halte ich ab 9. Mai 2016. Es sind jeweils 2 Tage, also insgesamt 4.
Die Anmeldung ist hier möglich. Wir sind wieder bei Data Technology zu Gast.
Seit einiger Zeit gibt es „RapidMiner-Sprechstunden”, bei denen ein Experte ein bestimmtes Thema per Webcasting vorstellt. Während der Sprechstunde kann man auch Fragen stellen; die Aufzeichnung ist dann auf Youtube verfügbar.
Ich werde am 20. April und dann am 1. Juni die Sprechstunde leiten.
Am 20. 4. ist „Geographic Processing and Visualization“ das Thema (auf Basis meiner Blogserie GIS in RapidMiner), am 1. 6. dann „Access Google Analytics using RapidMiner“.
Die Simulation von mathematisch beschreibbaren Prozessen ist für viele Anwendungen nützlich. Die „Monte-Carlo-Simulation“ ist eine elegante Methode, verschiedene Probleme zu lösen, etwa die Berechnung der Kreiszahl Pi.
RapidMiner wird zwar nicht unbedingt als Simulationswerkzeug beworben, aber auch diese Aufgabe läßt sich mit etwas Know-How leicht darin lösen. Und was liegt näher als die „Monte-Carlo-Simulation“ am Beispiel von (französischem) Roulette zu demonstrieren?
Roulette läßt sich einfach beschreiben: Die Spieler setzen auf verschiedene Bereiche eines Tisches. Diese Bereiche decken unterschiedlich große Teile des Zahlenraums zwischen 0 und 36 ab. Die Wahrscheinlichkeit, daß ein Zahlenfeld gewinnt, liegt bei 1/37; bei größeren Bereichen (z. B. vier Zahlen, sechs Zahlen, ein Drittel der Zahlen von 1-36, eine Farbe) bei Mehrfachen davon. Der Gewinn ist bei einzelnen Zahlen das 35-Fache des Einsatzes (zusätzlich zum Einsatz, den man behält), und nimmt bei größeren Bereichen proportional zum Risiko ab. Z. B. erhält man, wenn man etwa auf Rot gesetzt hat und die Kugel auf einem roten Feld landet, den Einsatz noch einmal zurück. Da auch das Feld 0 existiert, das von den meisten möglichen Einsätzen nicht abgedeckt ist, verdient die Bank auch manchmal Geld. Roulette ist wahrscheinlich das „fairste“ reine Glücksspiel, das man spielen kann. (Deswegen gibt es wohl auch „Amerikanisches Roulette“ mit einem zweiten Null-Feld – Die Kasinos in den USA haben sich mit 1/37 Gewinn nicht zufriedengegeben.)
Simulationsprozess
Der hier verfügbare Prozess simuliert wiederholte Besuche im Kasino mit einigen Einstellungen. Die Einstellungen lassen sich im Prozesskontext (View/Show Panel/Context) in Form von Makros setzen. Sie sind auch direkt im Prozess beschrieben.
Man legt die Anzahl der Besuche fest und die Anzahl der Spiele pro Besuch (solange man noch Geld übrig hat). Es läßt sich auch ein Betrag angeben, bei dessen Erreichen man freiwillig aufhört zu spielen. (Z. B. wenn man das anfängliche Guthaben verdoppelt hat.)
Die eigene Spielweise läßt sich im Makro „Risk“ einstellen. Hier legt man das gewünschte Risiko fest: von 2 (rot/schwarz, gerade/ungerade, 1-18/19-36) bis 36 (einzelne Zahl).
Der Prozess besteht aus zwei verschachtelten Schleifen (Loop Visits und Loop Bets) und danach etwas Datenaufbereitung für die Darstellung der Ergebnisse.
Die tatsächliche Berechnung einer Spielrunde findet in „Calculate bet results“ (Generate Attributes) statt. Aus dem Einsatz und dem Risiko wird der Gewinn (Einsatz + gewonnener Betrag) oder der Verlust (der Einsatz) berechnet; daraus dann das neue Spielguthaben.
Nach der Ausführung der äußeren Schleife werden Kennzahlen errechnet.
average(VisitWonPct): Anteil des Einsatzes, der durchschnittlich gewonnen oder verloren wurde. (Realistischerweise eher verloren, ausgedrückt durch eine negative Zahl.)
average(VisitReachedGoal): Anteil der Casino-Besuche, bei denen man das Ziel-Guthaben (z. B. 150 € bei einem Anfangsguthaben von 100 €) erreicht hat.
average(VisitLostEverything): Anteil der Casino-Besuche, bei denen man das gesamte Anfangsguthaben verloren hat.
average(VisitWonAmount): Durchschnittlich gewonnener oder verlorener Betrag.
Zusätzlich lassen sich die Verläufe der einzelnen Besuche grafisch darstellen:
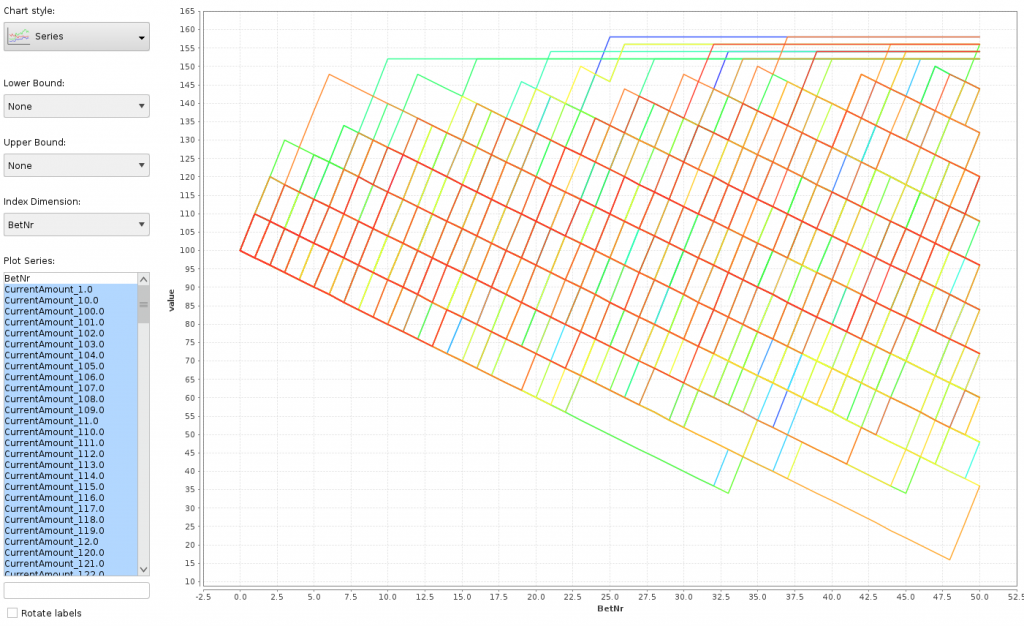
Dafür habe ich das Ergebnis „Pivot for series plot“ geöffnet, die Charts aktiviert, den Chart-Typ Series ausgewählt, die BetNr als Index-Dimension festgelegt und alle CurrentAmount-Spalten für die Plot Series markiert.
Jede Linie zeigt den Verlauf eines Casinobesuchs (pro Besuch eine Farbe). Die X-Achse ist die Spielrunde, die Y-Achse das Guthaben, das man nach dieser Runde hat. Es ist gut sichtbar, daß es Besuche gab, in denen man über 30 Runden nur verloren hat! Oben ist das Feld durch die Besuche begrenzt, in denen man vor Ablauf der geplanten Spielrunden den Zielbetrag erreicht hat.
Mit diesem Simulationsprozess, der auch mit RapidMiner Studio Basic (gratis und ohne Registrierung nutzbar) funktioniert, läßt sich gut feststellen, wie die Chancen im Casino stehen, wenn man mit einer „Strategie“ spielt. Wenig überraschend ist das Ergebnis überwiegend negativ.
Der Prozess ließe sich leicht für andere Arten von Spielen und generell andere Zwecke adaptieren. Eine Monte-Carlo-Simulation zur Annäherung von Pi wäre z. B. mit der gleichen Struktur möglich.
Simulation in RapidMiner
There are many applications for simulation of processes that can be described mathematically. The Monte Carlo simulation is an elegant method for solving different problems like calculating Pi.
RapidMiner is not advertised as a simulation tool, but with a bit of knowledge you can easily solve this task in it. So how about demonstrating Monte Carlo simulation with the example of French roulette?
The game of roulette is easy to describe. Players bet on different areas of a table. The areas cover smaller or larger sets of the numbers between 0 and 36. The probability of winning with a single number is 1/37; when betting on a larger area (e. g. four numbers, six numbers, one third of the numbers between 1 and 36, one color) it is a multiple of that. The won amount when guessing a number correctly is the 35 times the bet amount (and the player keeps the bet), and it decreases proportionally with the risk. For example, if you bet on red and the ball lands on a red field, you win an equal amount to your bet.
There is also a field with 0 that is not covered by most of the bets, so the bank also wins sometimes. Roulette is probably one of the most „fair“ games of luck available. (That’s probably the reason for the existence of American roulette that has a second 0 field: The US casinos weren’t satisfied with winning just 1/37 of the players‘ money.)
Simulation process
The process available here simulates repeated casino visits with a few settings. You can manipulate the settings in the process context (View menu/Show Panel/Context) in the Macros area. The process contains a description of each setting.
You can specify the number of visits and the betting rounds per visit (as long as there’s money left in the current visit). It is also possible to specify an amount that is enough to leave the casino before the specified number of rounds. (E. g. when you doubled the original amount.)
You can set a „style of gambling“ with the macro „Risk“. Here you specify the risk you’d like to try: it starts at 2 (red/black, even/odd, 1-18/19-36) and ends at 36 (betting on one number).
The process contains two loops, the first one (Loop Visits) holding the second one (Loop Bets) inside. After those there is some processing for displaying results.
The calculation of one betting round happens in „Calculate bet results“ (Generate Attributes). The amount lost or won in the round is calculated from the bet amount and the risk. This results in a change of the current amount.
After finishing the outer loop, the process calculates a few summary results.
average(VisitWonPct): Portion of the original amount that was lost or won in the average case. (Realistically, lost: this is expressed with a negative percentage.)
average(VisitReachedGoal): Portion of visits when reaching the desired amount (e. g. 150 € after starting with 100 €).
average(VisitLostEverything): Portion of visits when you lost everything.
average(VisitWonAmount): Average amount won or lost.
In addition to the numbers you can display each visit graphically:
Open the „Pivot for series plot“ result, go to Charts, select Series, select BetNr as the Index dimension and mark all CurrentAmount attributes as Plot Series.
Each line describes the course of a casino visit (one color per visit). The X axis is the betting round, the Y axis the available amount after the round. It is easy to see that in several visits up to 30 rounds have been lost! The upper limit is the specified „leaving amount“ that was reached before the number of specified rounds.
This simulation process even works in RapidMiner Studio Basic (available for free without registration). You can easily determine your chance of winning in the casino playing your „strategy“. It’s not a big surprise that the result is mostly negative.
It should be easy to change the process to simulate other games or events. For example, you could estimate Pi using the same process structure.
Nach der Artikelserie über GIS in RapidMiner Studio (1, 2, 3, 4) geht es nun darum, wie die erhaltenen Ergebnisse visualisiert werden können. In Studio sind die Möglichkeiten dafür ja ziemlich eingeschränkt: Punkt-Daten können noch halbwegs als Scatterplots angezeigt werden, aber für Linien und Flächen gibt es keine guten Methoden.
RapidMiner Server bietet aber mit den Webapps die Möglichkeit einer flexiblen Visualisierung durch die Einbindung von JavaScript.
Einbindung von GeoTools
Für die nachfolgende Vorgehensweise ist es nicht notwendig, den Server ähnlich wie Studio mit Geo-Libraries auszustatten. Wenn man jedoch die gleichen GIS-Funktionen wie in Studio verwenden will, kann es sinnvoll sein.
Ausgehend vom eingerichteten geoscript-Verzeichnis wie im ersten Teil der Anleitung werden die Jar-Bibliotheken aus diesem Verzeichnis in die EAR-Datei des Servers kopiert. Man braucht dazu ein Zip-Werkzeug, ich habe den Midnight Commander verwendet.
RapidMiner Server beenden
rapidminer-server/standalone/deployments/rapidminer-server-X.Y.Z.ear zur Sicherheit anderswo hinkopieren
Aus dem lib/-Verzeichnis die alte groovy-X.jar löschen und die neue aus der Studio-Installation hineinkopieren
Alle Jar-Dateien aus dem geoscript-Ordner der Studio-Installation auch in lib/ kopieren. Wenn eine Datei schon vorhanden ist, muß sie nicht überschrieben werden.
RapidMiner Server starten.
Danach sollten alle Prozesse mit GIS-Verarbeitung aus Studio auch am Server funktionieren.
Visualisierung in Webapps
Meine Wahl fiel auf die Leaflet-Library, da sie Open Source und gut dokumentiert ist. Da wir in RapidMiner keinen eigenen GIS-Datentyp haben und die bisherigen Prozesse die Geodaten als WKT (Well Known Text) verarbeiten, brauchen wir noch die Mapbox-Omnivore-Library. Diese konvertiert WKT-Daten in GeoJSON, das bevorzugte Format von Leaflet.
Vor der Erstellung des Webapps bauen wir einen Prozess in Studio, der die gewünschten Daten ausgibt. Ein Beispielprozess könnte vom Wiener Open-Data-Server die Bezirksgrenzen als CSV und Bevölkerungsstatistiken holen. Die Bezirke werden über ein gemeinsames Feld (NUTS-Id) verknüpft. Der Output des Prozesses ist eine Tabelle mit den Geodaten des Bezirks, ihrer Fläche, der Gesamtbevölkerung und der Bevölkerungsdichte. Für die Bevölkerungsdichte errechnen wir mit Generate Attributes die Anzahl der Personen pro Quadratkilometer und klassifizieren sie, indem wir verschiedenen Wertbereichen HTML-Farben in der #AABBCC-Notation zuweisen. Hier ist die eigene Kreativität gefragt.
Der Prozess wird auf den Server gelegt. Unter Processes/Services legen wir eine neue Eintragung an und nennen sie z. B. ViennaDistrictPopDensitySvc. Wir wählen als Datenquelle den vorhin angelegten Prozess und als Output Format JSON. Es ist sinnvoll, dieses Webservice als anonym/öffentlich aufzusetzen, um zusätzliche Paßworteingaben zu vermeiden.
In der neuen Webapplikation erzeugen wir eine Komponente vom Typ Text, und schalten „Use graphical editor“ ab. Danach geben wir den HTML- und JavaScript-Code ein.
Dieser Teil holt die Leaflet- und Omnivore-Komponenten und erzeugt ein Objekt, in das die Karte eingefügt werden kann. Im CSS wird die Höhe in Pixeln angegeben (z. B. 650px).
Danach starten wir mit <script language="JavaScript"> einen JavaScript-Block, der am Ende mit </script> geschlossen wird.
Hier erzeugen wir das Kartenobjekt mit einer OpenStreetMap-Hintergrundkarte. Die Initialisierungsparameter sind Längen- und Breitengrad der anfänglichen Position der Karte, die Zahl dahinter (11 in diesem Beispiel) die Zoom-Stufe.
Es gibt viele Tile-Server, man sollte die Nutzungsbedingungen prüfen und die Herkunftsangabe (attribution) entsprechend anpassen.
Daten des RapidMiner-Prozesses holen
var Httpreq = new XMLHttpRequest();
Httpreq.open("GET","/api/rest/public/process/ViennaDistrictPopDensitySvc?",false);
Httpreq.send(null);
var mapdata = JSON.parse(Httpreq.responseText);
Dieser Block holt vom lokalen (oder auch einem beliebigen anderen) RapidMiner Server die Daten des Prozesses im JSON-Format und legt sie im mapdata-Objekt ab. Die URL des Webservice kann hier angepaßt werden.
Anzeige der Geo-Objekte
for (i = 0; i < mapdata.length; i++) {
var district = omnivore.wkt.parse(mapdata[i].SHAPE);
district.addTo(map)
.bindPopup(mapdata[i].NAME + "
Population density: " + mapdata[i].POP_DENSITY)
.setStyle({color: mapdata[i].densityColor, weight: 2, fillOpacity: 0.3});
}
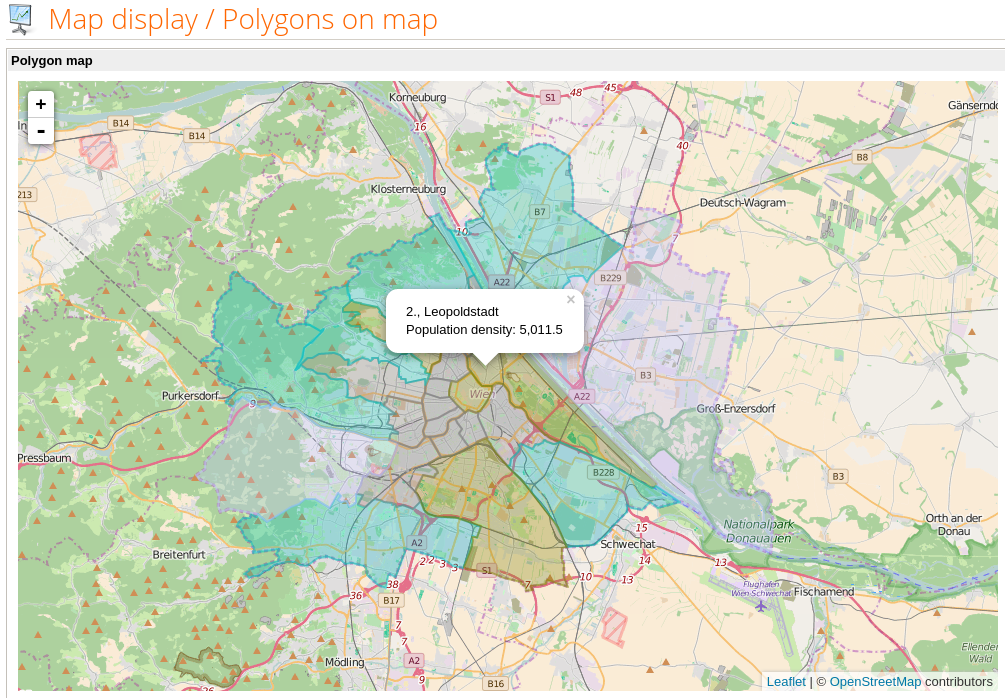
Hier verarbeiten wir die Ergebnisse des Prozesses in einer Schleife. Aus jeder Zeile wird die Form des Bezirks (Attribut SHAPE in den Beispieldaten) mit Hilfe von Omnivore konvertiert, und als neues Objekt zur Karte hinzugefügt. Mit .setStyle(...) ordnen wir die im Prozess erzeugte Farbabstufung (im Beispiel das densityColor-Attribut) zu. Als zusätzliche Information erzeugen wir mit .bindPopup(...) noch ein Popup-Fenster, das beim Klick auf einen Bezirk angezeigt wird und zusätzliche Informationen enthält.
Linien-Daten werden ganz ähnlich angezeigt und verarbeitet. Bei Punkt-Daten können verschiedene Marker definiert werden, bei Leaflet gibt es die Anleitung dazu.
Damit ist das Ziel erreicht: RapidMiner Server zeigt eine Karte an, deren Daten (Punkte, Linien oder Flächen) in einen RapidMiner-Prozess verarbeitet wurden.
After the series of blog posts about GIS in RapidMiner Studio (1, 2, 3, 4) we’d probably like to visualize our results. The mechanisms in Studio are quite limited: we can create scatter plots from point data but there is no good method for displaying lines and areas.
However, RapidMiner Server offers webapps and powerful visualization using JavaScript.
Using GeoScript in processes
For displaying geographic data it’s not necessary to set up the server with the GeoScript libraries. However, if you want to execute the GIS processes like in studio, it can be a good idea to do so.
Start with the geoscript directory set up in the first part. You’ll need a Zip utility; I used Midnight Commander.
Stop RapidMiner Server
Make a backup copy of rapidminer-server/standalone/deployments/rapidminer-server-X.Y.Z.ear somewhere else
Delete the old groovy-X.jar from the lib/ directory and put in the new one from the Studio installation
Copy all jar files from the geoscript directory of the Studio installation to lib/. Existing files don’t need to be overwritten.
Start RapidMiner Server.
After this process, all your Studio GIS processes should work in the Server.
Map display in webapps
I chose the Leaflet library, as it is open source and well documented. There is no special GIS data type in RapidMiner and the processes in the tutorials used WKT (Well Known Text) until now, so we’ll also need the Mapbox Omnivore library. This converts WKT data to GeoJSON which Leaflet prefers.
Before starting with the web app, we need to build a process in Studio for creating the data. An example process could use the district boundaries as CSV and the population statistics from the Vienna Open Data server. It joins the districts using a common attribute (NUTS id). The output of the process is a table with the district boundaries, their area, the total population and the population density. We also use Generate Attributes to classify the population density with HTML colors (#AABBCC notation). You can get creative here and use the entire functionality of RapidMiner.
The process is saved on the server. We create a new entry in Processes/Services and call it for example ViennaDistrictPopDensitySvc. The data source is the process created before, the output format is JSON. It is a good idea to set up this web service for public anonymous access.
In a new web app we create a Text component and uncheck the „Use graphical editor“ checkbox to enter HTML and JavaScript code.
This part fetches the Leaflet and Omnivore components and creates a DIV object for the map. We specify the map height in pixels in the CSS block (e. g. 650px).
Then a JavaScript block is started with <script language="JavaScript">. Don’t forget to close the block with </script> at the end.
This creates a map object with an OpenStreetMap background layer. The initialization parameters are latitude and longitude of the initial position, and the zoom level (11 in this example).
There are many tile servers available. Be sure to check the terms of usage and update the attribution appropriately.
Getting data from the RapidMiner process
var Httpreq = new XMLHttpRequest();
Httpreq.open("GET","/api/rest/public/process/ViennaDistrictPopDensitySvc?",false);
Httpreq.send(null);
var mapdata = JSON.parse(Httpreq.responseText);
This part fetches the data in JSON format from the local RapidMiner Server and stores them in the mapdata variable. To refer to another web service, change the URL.
Displaying the objects on the map
for (i = 0; i < mapdata.length; i++) {
var district = omnivore.wkt.parse(mapdata[i].SHAPE);
district.addTo(map)
.bindPopup(mapdata[i].NAME + "
Population density: " + mapdata[i].POP_DENSITY)
.setStyle({color: mapdata[i].densityColor, weight: 2, fillOpacity: 0.3});
}
Here, a loop processes the process results. The Omnivore function converts the district area (SHAPE attribute in the example data) to a new object on the map. We assign the color calculated in the process with .setStyle(...) (densityColor attribute in this example). We also create a popup window with additional information using .bindPopup(...). It will be displayed when the user clicks a district.
Displaying line data is very similar. For displaying point data, you can use different markers. This is described by a Leaflet tutorial.
So we reached our goal: RapidMiner Server displays a map with data (points, lines or areas or even a combination) coming from a RapidMiner process.
In diesem vierten Teil geht es um die Filterung von Datensätzen und die Verbindung mehrerer Datensätze anhand geographischer Kriterien. (Um die Beispiele nachzuvollziehen, muß RapidMiner wie in der Einführung beschrieben um die GeoScript-Libraries ergänzt werden.)
Da kein eingebauter Join-Operator für geographische Kriterien existiert, bauen wir diese Operation nach, indem wir jedes Element der beiden Datensätze miteinander vergleichen und das Ergebnis dann filtern. Der Vergleich wird mit geographischen Operationen durchgeführt.
In den bisherigen Beispielen wurde mit Hilfe des Cartesian-Product-Operators jede Kombination der Datensätze gebildet. Die andere Möglichkeit ist, in einer Schleife alle Elemente eines Datensatzes mit denen des anderen zu vergleichen.
(Dies ist wieder ein Bereich, in dem PostGIS mit geographischen Indizes in der Datenbank eine wesentliche Beschleunigung bietet, die bei wirklich großen Datenmengen auch noch gut funktioniert.)
Einige Funktionen, die uns für die Verbindung von Datensätzen zur Verfügung stehen:
distance: Diese Funktion haben wir bereits kennengelernt. Wenn wir die Distanzen aller Kombinationen bestimmt haben, können wir das Ergebnis filtern, um z. B. jene herauszufiltern, deren Distanz einen bestimmten Wert nicht überschreitet.
intersects: Liefert true, wenn die Objekte sich an mindestens einem Punkt überschneiden.
intersection: Erzeugt die Überschneidung der Objekte als neues geometrisches Objekt. Der Typ des überschneidenden Bereichs orientiert sich an den verglichenen Objekten: Z. B. ist die Überschneidung einer Fläche mit einer Linie wieder eine Linie. Wir können mit dem Ergebnis natürlich weiterarbeiten und z. B. die Fläche oder andere Kennzahlen bestimmen und darauf filtern.
contains: A.contains(B) liefert true, wenn das Objekt A das Objekt B vollständig enthält, also kein Teil von B außerhalb von A liegt.
Bei intersects und intersection ist die Richtung des Aufrufs egal (A.intersects(B) ergibt das gleiche wie B.intersects(A)). Bei contains jedoch nicht: Eine Fläche A kann einen Punkt B enthalten, was im umgekehrten Fall nicht gilt.
Eine häufig verwendete geographische Operation ist das Buffering, das mit der buffer-Funktion realisiert wird. Hierbei wird um das ursprüngliche Objekt (Punkt, Linie, Fläche) eine Fläche erzeugt, deren Grenze die im Funktionsaufruf angegebene Distanz zum Objekt hat. Das Ergebnis ist somit immer eine Fläche. Damit können wir verschiedene Dinge wie Einzugsgebiete von Geschäften, die Reichweite von Funkantennen oder die tatsächliche Fläche einer als Linie mit Breitenangabe angegebenen Straße berechnen. Mit der Berechnung des Buffers werden auch häufig Distanz-Vergleiche mit Hilfe von contains oder intersects durchgeführt.
Die Vorgehensweise in RapidMiner ist diese: zuerst werden in einem Execute-Script-Operator mit Groovy/GeoScript die benötigten Ergebnisse ermittelt (z. B. contains: true/false) und danach die Ergebnismenge mit Filter Examples gefiltert, sodaß nur die Objekte übrigbleiben, auf die das gewünschte Kriterium zutrifft (z. B. contains = true oder distance < 10).
Der Beispielprozess existiert in zwei Varianten: einmal mit Cartesian Product und einmal mit Loop Examples. Die erste Variante ist deutlich schneller, braucht jedoch sehr viel Speicher, weil sie riesige Tabellen anlegen muß. Die zweite Variante braucht viel länger, aber der Speicherverbrauch ist geringer, da keine „multiplizierten“ Datensätze erzeugt werden.
Für manche Operationen wie intersects oder contains ist die Projektion unerheblich (solange beide Geometrien im gleichen Koordinatensystem angegeben sind). Für buffer müssen wir aber eine Ausdehnung angeben, somit ist es wieder zweckmäßig, mit einer Meter-basierten Projektion zu arbeiten. Deswegen transformieren die Beispielprozesse alle Datensätze in die für Österreich geeignete Projektion EPSG:3416.
Drei Datensätze werden vom Wiener Open-Data-Server geholt: Wasserflüsse (Linien), Brücken (Flächen) und Spielplätze (Punkte). Dann sucht der Prozess mit intersects und intersection die Bereiche, in denen die Brücke über Wasser führt. Mit buffer wird der Bereich um die Wasserflüsse markiert, in dem mit contains nach Spielplätzen gesucht wird. Das Ergebnis ist dann eine Liste von Spielplätzen, die nahe an einem Bach oder Fluß liegen.
Damit ist diese Serie über GIS in RapidMiner vorerst abgeschlossen. Die besprochenen Methoden decken schon eine große Anzahl von Aufgaben ab, und mit etwas Kreativität ist noch viel mehr möglich. Ich werde sicherlich noch Anwendungen und Lösungen finden und darüber auch hier berichten. Wenn etwas unklar sein sollte, beantworte ich gerne Fragen: hier in den Kommentaren, im RapidMiner-Forum, oder auch direkt. Ich wünsche viel Erfolg!
GIS in RapidMiner (4) – Geographic Filter and Joins
The fourth part of this series is about filtering and joining example sets on geographic criteria. (RapidMiner needs to be extended with the GeoScript libraries as described in the Introduction for the examples to work.)
There is no built-in Join operator with support for geographic functions. So we reproduce this functionality by comparing each element of both example sets and filter the result. Geographic functions are used for the comparison.
In the examples until now, we used the Cartesian Product operator for building an example set with each combination of examples. The other way is a Loop over each element of example set 1 that compares the one example of the loop with all elements of example set 2.
(This is also an area where PostGIS shines with geographic indexes in the database that improve processing times by a huge factor, even in the case of huge tables.)
Some geographic functions usable for joining or connecting example sets:
distance: We already saw this. After calculating the distance of all combinations, we can filter the result set to only contain those within a certain distance.
intersects: Returns true if the objects have at least one point in common.
intersection: Creates a new geometry with the common parts of both objects. The type of the result depends on the compared objects: e. g. the intersection of an area and a line is again a line. The resulting geometry can be processed further, for example by calculating its area or other measures and filtering on those.
contains: A.contains(B) returns true if object A fully contains B, in other words, no part of B is outside of A.
The order of the objects is not relevant when using intersects and intersection: A.intersects(B) has the same result as B.intersects(A). This is not true for contains: An area A can contain point B but this is not true for the opposite.
Buffering is a popular geographic operation, available in the buffer function. Buffering creates an area around the original object (point, line, area) with a border in a distance specified in the function call. The result is always an area. We can calculate different things with buffering: the service area of shops, the coverage of wireless antennas or the actual area of a street that is specified as a line but has a width attribute. After creating the buffer, less-or-equal distance calculations can be done with contains or intersects.
The following work flow is available in RapidMiner: first, in an Execute Script operator we process the data using geographic functions with Groovy and GeoScript (e. g. contains: true/false); then we filter the result set with Filter Examples to only keep examples with the selected criteria (e. g. contains = true or distance < 10).
There are two variants of the example process: one with Cartesian Product and one with Loop Examples. The first version is much faster but needs a huge amount of memory as it has to create very large tables. The second version takes much longer but uses less memory, as it doesn’t need to process „multiplied“ data sets.
For some operations like intersects oder contains, the projection is not relevant (as long as both geometries use the same coordinate system). But we need to specify the border size in buffer, so it is again better to work with a meter based projection. Therefore, the example processes transform the original geometries to EPSG:3416, a projection suitable for Austria.
The process fetches three data sets from the Vienna Open Data Server: Water flows (lines), Bridges (areas) und playgrounds (points). It then uses intersects and intersection to find areas where the bridge is over water. Using buffer, it marks an area around water flows and uses contains to find playgrounds in that area. The result is a list of playgrounds in the vicinity of streams or rivers.
This concludes the series about GIS in RapidMiner for now. The described methods solve a range of problems, and many more can be solved with some creativity. I will surely find use cases and solutions, and describe them here. If something is not clear, please ask: here in the comments, in the RapidMiner Forum or even directly. I wish you a lot of success!
Nach der Einführung und dem Datenimport geht es nun an echte geographische Berechnungen.
Eine der wichtigsten Informationen ist die Distanz von Objekten voneinander oder einem Referenzpunkt. Auch Data-Mining-Verfahren wie k Nearest Neighbors berechnen Distanzen.
Zwei verschiedene Methoden stehen uns zur Verfügung, um Distanzen zwischen zwei Punkten auf der Erdoberfläche zu berechnen: Entweder können wir die Punkte als zweidimensionale Geometrie mit X- und Y-Koordinaten auffassen (die Berechnung ist dann ganz einfach), oder die Distanz auf der Oberfläche des Ellipsoids der Erde ausrechnen. Die zweite Vorgehensweise ist mathematisch natürlich deutlich aufwändiger, liefert aber bei größeren Distanzen (z. B. Orte auf verschiedenen Kontinenten) genauere Daten. Deswegen wird in vielen Anwendungen, die nur Objekte in einem eingeschränkten Gebiet enthalten, auf die erste Methode zurückgegriffen.
Transformation in eine andere Projektion (Koordinatensystem)
Wie in der Einführung ausgeführt müssen wir die Geometrien manchmal in andere Projektionen transformieren, um mit sinnvollen Einheiten wie Meter rechnen zu können. Die Methoden dafür sind in GeoScript enthalten und ihre Anwendung ist recht einfach:
import geoscript.proj.*;
fromProj = new Projection("epsg:4326");
toProj = new Projection("epsg:3035");
projectedGeom = Projection.transform(geom, fromProj, toProj);
Ein fertig anwendbarer RapidMiner-Prozess befindet sich hier. Er braucht drei Parameter, die als Makros im Prozesskontext definiert sind und beim Aufruf angegeben werden können:
GEOM_ATT: Name des Attributs, das die zu transformierende Geometrie (im WKT-Format) enthält
FROM_PROJECTION, TO_PROJECTION: Die EPSG-Nummern der Quell- und Zielprojektion.
Damit lassen sich die Koordinaten leicht von einem allgemeinen Koordinatensystem wie WGS84 (Längen- und Breitengrad, EPSG:4326) in ein gebräuchlicheres wie z. B. ETRS89/Austria Lambert (EPSG:3416) konvertieren. Das werden wir im nächsten Beispielprozess anwenden, um Distanzen zwischen Objekten in Wien, aber auch Fläche und Umfang von Bezirken zu berechnen.
Berechnung von Distanz, Fläche und Umfang
GeoScript enthält dafür einfach anzuwendende Funktionen:
flaeche = geom.getArea();
umfang = geom.getLength();
//Für die Distanz brauchen wir eine zweite Geometrie
distanz = geom1.distance(geom2);
Sobald man das Geometrie-Objekt in einer richtigen Projektion hat, sind die Berechnungen ganz simpel.
getArea() liefert die Fläche eines Polygons oder einer Polygongruppe (Multipolygon); getLength() die Länge einer Linie oder den Umfang eines Polygons, jeweils in den Einheiten der aktuellen Projektion.
Für die Distanz brauchen wir ein zweites Geometrie-Objekt, das nicht unbedingt ein Punkt sein muß – es ist auch möglich, die Distanz zwischen Linien und Flächen zu berechnen.
Der Beispielprozess holt zwei Datensätze vom Open-Data-Portal der Stadt Wien: Museen (Punkte) und Bezirksgrenzen (Polygone). Beide werden aus Längen- und Breitengrad-Koordinaten in eine in Österreich gebräuchliche, meter-basierte Projektion transformiert. Mit getArea() und getLength() werden Fläche und Umfang der Bezirke berechnet. Da der Original-Datensatz diese Information bereits enthält, können wir leicht prüfen, ob die Berechnungen korrekt sind. (Kleine Unterschiede resultieren wohl aus der Rundung der Koordinaten für den CSV-Export.)
Dann wird noch der erste Bezirk selektiert und mit dem Museums-Datensatz zusammengeführt. In diesem kombinierten Datensatz haben wir nun zwei Geometrien, wir können also die Entfernung des Museums von der Innenstadt berechnen. Punkte, die im Polygon des ersten Bezirks liegen, haben die Distanz 0.
Berechnung von Distanzen auf der Erdoberfläche
Die zweite, genauere, aber langsamere Berechnungsmethode kann auch recht einfach angewendet werden. Hierfür importieren wir aus der GeoTools-Library, auf die GeoScript aufbaut, die Klasse GeodeticCalculator. (Die Bibliotheken, die wir in der Einführung für GeoScript übernommen haben, reichen dafür aus, wir müssen also nichts Neues installieren.)
Für diese Methode brauchen wir die Längen- und Breitengrade von zwei Punkten, also WGS84-Koordinaten. (Es gäbe auch die Möglichkeit, transformierte Koordinaten zu verwenden, dafür müßten wir dem GeodeticCalculator auch das Koordinatensystem übergeben.)
Hier ist es wichtig, die Reihenfolge der Koordinatenangaben zu beachten. In anderen Bereichen sind wir gewohnt, X- und Y-Koordinaten in dieser Reihenfolge anzugeben, GIS-Systeme arbeiten jedoch manchmal mit der Reihenfolge Y, X.
Der Beispielprozess enthält die Koordinatenpaare einiger Hauptstädte auf verschiedenen Kontinenten. Mit einem Cartesian Product werden alle Städte mit allen anderen verknüpft und jeweils die Distanzen in km berechnet. (Die berechneten Distanzen habe ich mit PostGIS verifiziert; die Ergebnisse sind sehr genau.) Für diese Distanzen würde eine Berechnung mit der Geometrie-Methode schon sehr große Ungenauigkeiten liefern, hier empfiehlt es sich also sehr, die GeodeticCalculator-Methode zu nutzen.
After the introduction and data import we can start to perform actual geographic calculations.
One of the most important measures is the distance of objects from each other or from a reference point. Distances are also calculated by data mining operations like k Nearest Neighbors.
Two different methods of calculating distances between points on the surface of Earth exist: Either we can pretend that the points are in a two-dimensional geometry with X and Y coordinates (which makes the distance calculation very easy), or we use the actual Earth ellipsoid for the calculation. The second method is very computing-intensive, but it returns more precise results when used on larger distances (e. g. places on different continents). For many operations acting on a limited area, the first method is used.
Transformation to another projection (coordinate system)
As described in the introduction, we often need to transform geometries to different projections so we can use units like meters. Coordinate system transformation is also available in GeoScript, and using it is quite easy.
import geoscript.proj.*;
//Source and destination projections
fromProj = new Projection("epsg:4326");
toProj = new Projection("epsg:3035");
projectedGeom = Projection.transform(geom, fromProj, toProj);
Here is a readily usable RapidMiner process. It takes three parameters that can be specified as macros in the process context. You can overwrite them when calling the process in the Execute Process operator.
GEOM_ATT: Name of the attribute that contains the geometry to be transformed (in WKT format)
FROM_PROJECTION, TO_PROJECTION: The EPSG numbers of the source and target projections
With this process, you can easily transform geometries from a common coordinate system like WGS84 (Latitude and Longitude, EPSG:4326) to a special one, for example ETRS89/Austria Lambert (EPSG:3416). We will use this in the example process for calculating distances between objects in Vienna, Austria and also determine the area and circumference of Vienna’s 23 districts.
Calculating distance, area and circumference
GeoScript contains easy to use functions:
area = geom.getArea();
circumference = geom.getLength();
//We need a second geometry for calculating distance
distance = geom1.distance(geom2);
After having transformed the geometry object into a matching projection, the calculations are really simple.
getArea() returns the area of a polygon or a group of polygons (Multipolygon); getLength() gives the length of a line or the circumference of a polygon in the units of the used projection.
For calculating the distance, a second geometry object is required. It doesn’t need to be a point: it’s also possible to calculate the distance between lines and areas.
The example process fetches two data sets from the Vienna Open Data Portal: Museums (points) and district borders (polygons). The process transforms then from latitude and longitude coordinates into a projection used in Austria. One script calculates the area and circumference of the districts using getArea() and getLength(). The original data set already contains these measures so we can easily check that they’re correct. (Small differences are the consequence of rounding the coordinates for CSV export.)
After that, the first district (Inner City) is selected and joined with the museum data set. The combined data set contains two geometries in a common projection, so we can calculate the distance between the museum and the Inner City. Points in the first district have a distance of 0.
Calculating distances on the surface of Earth
The second calculation method (more precise but slower) can also be used quite easily. For this, we import the class GeodeticCalculator from the GeoTools library, a base component of GeoScript. (The GeoScript libraries installed in the introduction are enough for this, we don’t need to set up more stuff.)
For using this method, we need latitude and longitudes of two points, in other words WGS84 coordinates. (It would be possible to use transformed coordinates by specifying a coordinate system in the GeodeticCalculator.)
Be careful when specifying the coordinates. We usually write X and Y coordinates in this order but GIS tools often use the order Y, X.
The example process contains coordinate pairs of a few capital cities lying on different continents. We build a Cartesian Product of all cities and calculate their distances in kilometers. (The distances were verified with PostGIS, they are very precise.) On these distances, using the geometry method would result in huge inaccuracies, so it’s really better to use the GeodeticCalculator method there.
Shapefile ist ein etabliertes Dateiformat, das zusätzlich zu den Geodaten auch eine Liste von Attributen der abgebildeten Objekte enthalten kann. Die geographischen Objekte können vom Typ Punkt (Point), Linie (LineString) und Polygon sein, jeweils als einzelne oder als Multi-Objekte (MultiPoint usw.).
Meistens bekommt man Shapefile in Form von Zip-Archiven, die die Shape-Datei selbst (*.shp), die Attributdatebank (*.dbf), die Information zur verwendeten Projektion (*.prj) und weitere enthalten.
Wer keine Shape-Datei zur Verfügung hat, findet z. B. bei Geofabrik oder auf Open-Data-Sites (AT, US) welche.
Der RapidMiner-Prozess fürs Einlesen der entpackten Datei ist gleichzeitig eine gute Einführung in die Datenstrukturen von RapidMiner.
Der Prozess steht hier zum Download bereit. Da der Dateiname als Makro im Prozesskontext (View/Show View/Context) definiert wird, steht dieser Prozess als fertiges „Element” zum Einbinden in eigene Prozesse zur Verfügung; der Filename-Parameter wird im aufrufenden Prozess unter „macros” eingetragen.
Nach dem Einlesen der Shape-Datei werden die Metadaten abgefragt (Layer.schema.fields), danach werden die einzelnen Elemente (Features in der GIS-Terminologie) gelesen:
def shp = new Shapefile("%{FILENAME}")
int fields = shp.schema.fields.size();
...
shp.schema.fields.each{f -&gt;
...
fieldMeta[fld] = f;
}
...
shp.features.each { f -&gt;
data = new Object[fields];
fieldMeta.each{ attr -&gt;
data[fld] = f.get(attr.name).toString();
}
fld++;
}
Der RapidMiner-spezifische Teil erzeugt zuerst ein Array mit den Attributen, deren Namen und Datentypen aus den Fields des Shapefile-Schemas aufgebaut werden. Mit dem Attribut-Array wird dann ein ExampleTable erzeugt. Nach dem schrittweise Befüllen des data-Arrays wird jedes Example mit einem DataRowFactory erzeugt und ans ExampleTable angefügt. Dieses wird am Ende in ein ExampleSet umgewandelt und als erster Output ausgegeben.
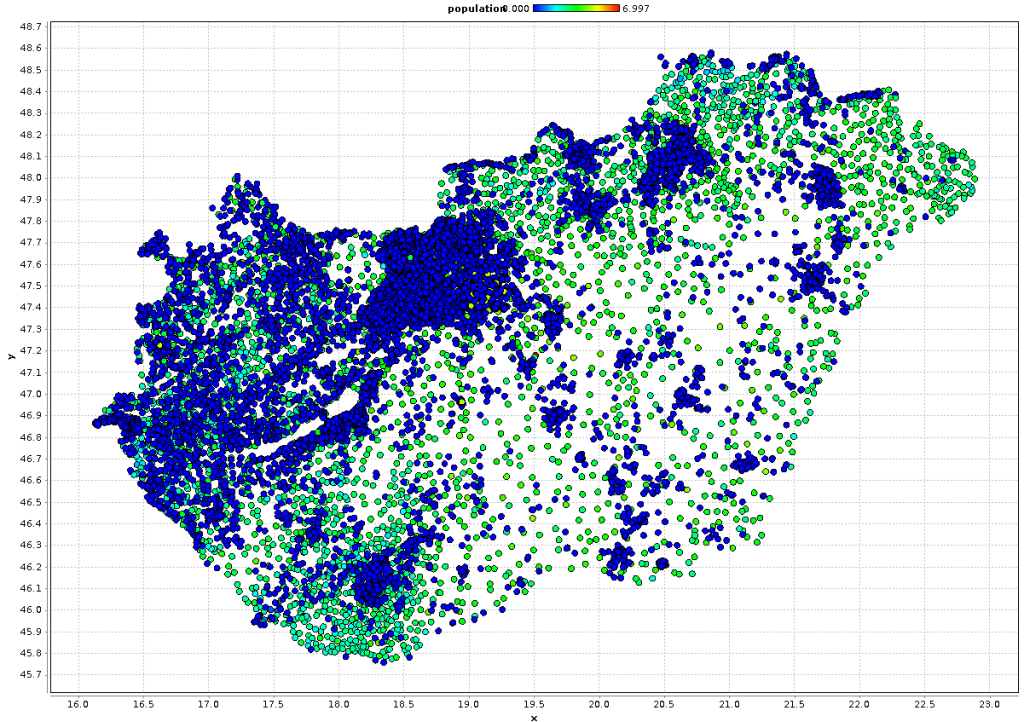
Das Ergebnis des Skript-Aufrufs ist ein normales RapidMiner-ExampleSet, dessen Metadaten aus dem Shapefile stammen. Numerische Attribute sind entsprechend konvertiert, sodaß der Datensatz ganz normal weiterverwendet werden kann. Handelt es sich um eine Geometrie aus Punkten, kann man sogar leicht die X- und Y-Koordinaten extrahieren und den Datensatz darstellen (in diesem Beispiel Orte in Ungarn):
Shapefile is a popular file format that is able to store geospatial data with additional attributes of each object. Points, LineStrings, Polygons and their Multi-versions (e. g. MultiPoint) are supported.
Usually a “shapefile” is a Zip archive that contains the shape file itself (*.shp), the database of attributes (*.dbf), the projection information (*.prj) and more.
If you don’t have a shapefile for testing yet, you can find some at Geofabrik and on Open Data sites (AT, US).
The RapidMiner process that reads the unpacked file is also a good introduction into the data structures of RapidMiner.
The process is available for download here. The file name is defined in the process context as a macro (View/Show View/Context), so you can use this process as a ready-to-use element in your own processes. Just include the file name to import in the macros entry of the Execute Process operator.
After reading the shapefile, the script determines the metadata of the fields (Layer.schema.fields) and reads the elements (called feature in GIS software).
def shp = new Shapefile("%{FILENAME}")
int fields = shp.schema.fields.size();
...
shp.schema.fields.each{f -&gt;
...
fieldMeta[fld] = f;
}
...
shp.features.each { f -&gt;
data = new Object[fields];
fieldMeta.each{ attr -&gt;
data[fld] = f.get(attr.name).toString();
}
fld++;
}
The RapidMiner specific part creates an array for the attributes and reads their names and data types from the Fields of the shapefile Schema. An ExampleTable is created from the attribute array. After filling a data array step by step, it is converted to a data row using a DataRowFactory and appended to the ExampleTable. This table is converted to an ExampleSet and returned as the first output of the operator.
The script execution returns a normal RapidMiner ExampleSet with metadata and data from the shapefile. Numeric attributes are converted correctly. If you have a Point geometry, you can easily extract the X and Y coordinates and display the data in a scatterplot (in this example all places in Hungary).