Da man immer wieder auf Datenquellen im JSON-Format stößt, möchte ich auch zeigen, wie man sie mit RapidMiner verarbeitet.
Früher gab es nur den Operator „Json to XML“. Dieser versucht, die JSON-Datenstruktur in XML abzubilden, sodaß man sie dann mit dem vorhandenen Read XML-Operator verarbeiten kann. Leider schlägt das in vielen Fällen fehl, da JSON wesentlich weniger strukturiert sein kann als XML.
Mit der Version 6.2 wurde aber ein genialer Operator eingeführt, der die Verarbeitung extrem erleichtert und elegant macht: Json to Data. Im Prinzip bildet er die Struktur des JSON-Dokuments mit der kompletten Hierarchie inkl. Arrays in Spalten ab, die nach dem „JSON-Pfad“ zum Element benannt sind.
Natürlich können da sehr breite Datenstrukturen rauskommen, aber damit hat RapidMiner kein Problem. Mit einem simplen Trick kann man diese „unbequeme“ Datenstruktur bearbeiten: Der Transpose-Operator transponiert die Spalten in Zeilen, und erzeugt damit eine viel simplere Tabelle, die leicht weiterzuverarbeiten ist.
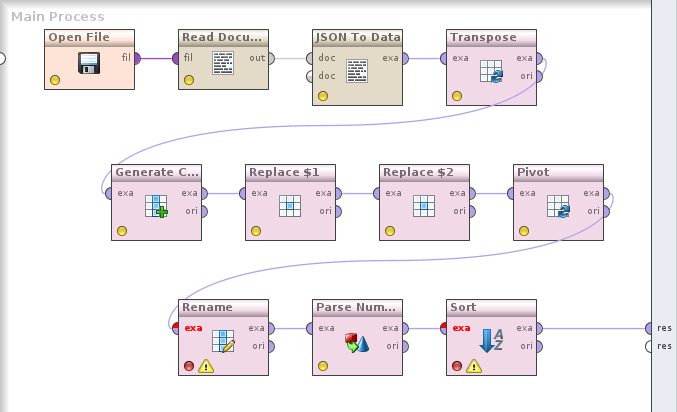
So sieht der Prozess zur Verarbeitung des JSON-Dokuments aus dem letzten Betrag aus:

Open File öffnet die URL und gibt ein File-Objekt aus. Read Document liest den Inhalt des File-Objekts und gibt ihn als Document (unstrukturierter Text) aus. JSON To Data konvertiert das Dokument in eine RapidMiner-Tabelle (in diesem Fall mit 24.000 Spalten und einer Zeile). Transpose klappt die Zeilen und Spalten dann um.
Es ist sinnvoll, einen Haltepunkt auf Transpose zu setzen (F7, Breakpoint after) und die Daten anzuschauen. Es gibt eine ID-Spalte, die den Pfad zu den Daten (in diesem Fall in Array-Syntax: [x][y]) enthält, und eine Attribut-Spalte, die die Daten selbst enthält. Alles wurde in Strings konvertiert.
Beispiel-Ausgabe:
| id | att_1 |
| [0][0] | 194.0 |
| [0][10] | Conglomerates |
| [0][11] | Minnesota |
Da wir die zwei Dimensionen des Arrays in zwei separaten Spalten brauchen, kopieren wir die ID-Spalte, und transformieren sie und ihre Kopie mit regulären Ausdrücken. Das Ergebnis sieht so aus:
| id | id2 | att_1 |
| 0 | 0 | 194.0 |
| 0 | 10 | Conglomerates |
| 0 | 11 | Minnesota |
Das id-Feld ist die Gruppe und das id2-Feld der Spaltenindex. Diese Struktur wird mit dem Pivot-Operator so konvertiert, daß id die Zeile definiert und id2 die Spalten. Diese brauchen dann nur mehr umbenannt zu werden. Danach werden noch die String-Spalten in Zahlen konvertiert und das Ergebnis nach dem Sort-Feld sortiert.
Fertig! Elegant und intuitiv, wie von RapidMiner gewohnt.
Processing JSON documents in RapidMiner
Data scientists frequently have the requirement to process JSON documents. I’d like to show how one can process them in RapidMiner.
Until recently, the only way was using the operator „Json to XML“. This operator tries to convert the original structure of the JSON document to XML so it can be processed using Read XML. Unfortunately, JSON is usually less structured than XML so this fails quite often.
A great operator was introduced in version 6.2 that makes processing JSON much easier and more elegant: Json to Data. It converts the structure of the JSON document to columns named by the „JSON path“ of the element.
This can lead to very broad data structures with hundreds or thousands of columns, but this is not a problem for RapidMiner. Using a simple trick, this unusual data representation can be changed: the Transpose operator flips columns to rows, so the table becomes much simpler.
This is a process for loading an example JSON array from the web and converting it into a tabular structure with metadata:

Open File loads the contents from the URL and returns a File object. Read Document reads the contents of the file and returns an unstructured Document object. JSON to Data takes the document and converts it into a RapidMiner example set. (In this case, the table has 24,000 columns and one row.) Transpose changes the columns into rows.
You could set a breakpoint on Transpose (F7, Breakpoint after) and look at the data. There’s an ID column which contains the JSON path of the attribute value (in this case, in array syntax: [x][y]), and an attribute value column with the data. Everything was converted to strings.
Example:
| id | att_1 |
| [0][0] | 194.0 |
| [0][10] | Conglomerates |
| [0][11] | Minnesota |
We need both dimensions of the array as separate columns, so we copy the ID column and transform both copies using regular expressions. This is the result:
| id | id2 | att_1 |
| 0 | 0 | 194.0 |
| 0 | 10 | Conglomerates |
| 0 | 11 | Minnesota |
The id field is the group and id2 the column index. This structure is processed with the Pivot operator by using id as the row identifier and id2 as the column. Then we rename the columns, convert string columns to numbers and sort the results by the value of the Sort field.
That’s it! Elegant and intuitive, thanks to RapidMiner.